Earlier this year, the
Marine Conservation Society (alongside retailer
Marks & Spencers) organised their first ever
Big Beach Clean Up. Over 6,000 volunteers got involved and lent a helping hand in cleaning up 100 beaches and waterways across the UK. The amount of effort and cooperation was fantastic and everyone should be so proud of themselves. I was supposed to be one of those volunteers at the Bridlington Beach Clean but I had far too much on (with regards to university work) and, after taking a weekend out already, I just couldn't afford the time off. Shockingly, over
3,200 bin bags of rubbish were collected in total. This amounted to
in excess of 11,500kg! That's an absolutely disgusting amount of waste found.
The final report devised by the MCS can be seen here (with some lovely photos, too!)
From the report, the MCS identified a few main key components of the rubbish, these included:
- Plastic parts
- Glass
- Consumer rubbish (i.e. crisp packets, lolly sticks)
- Caps and lids
- String, cord, cloth, and string.
- Polystyrene
- Fishing line
- Cigarette butts
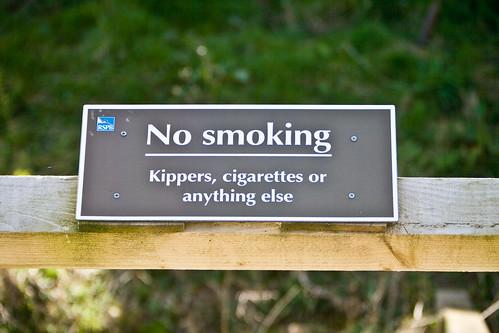
What they found hasn't surprised me in the slightest - I've wandered along beaches before, frequently kicking at old beer cans (obviously picking them up afterwards), bottle tops, and the amount of cigarette butts I've seen is just repulsive... Smokers, the beach is
not your ashtray. In fact, there are numerous campaigns about by the MCS or Surfers Against Sewage that are trying to stop this... I came across one of the SAS campaigns and it did make me giggle. Very effective if I might add!
 |
| No butts on the beach! |
BACKGROUND INFORMATION
As human population and waste levels explode, the oceans which cover 71% of the Earth's surface are in grave danger of becoming what can only be described as 'plastic soup' . Plastics have been part of our everyday lives for over 50 years now. Compared to glass or metals they are much cheaper to produced in the masses and tend to be more durable. As such, plastics have replaced much of these materials and, unfortunately, constitute a large proportion of the marine litter problem. Scientists have revealed that
up to 80% of the waste found on the coast, ocean surface or seabed is plastic. That's a shocking amount, however considering that the annual plastic production (globally) has been estimated to be in excess of 250 million tonnes (!!) this figure does not seem so shocking - especially when Greenpeace suggested than up to 10% of these end up on our oceans. Whilst it is near impossible for plastics to be eliminated entirely, there are a series of methods that can help mitigate this problem.
 |
Image by Lindsey Hoshaw
Source: http://www.thedailygreen.com/environmental-news/latest/great-pacific-garbage-patch-photos-460410 |
As I am sure you are all aware, the oceans are not closed systems and are all connected by currents; they just do not represent a static environment in the slightest. This means that point sources of marine debris often result in the mass movement elsewhere, carried by these currents. Where several currents meet, their convergence zone, marine debris often accumulates in large patches, the largest of which known as the "Great Pacific Garbage Patch" (see image above). The collision of four ocean currents creates a vortex that draws in the litter and keeps it contained in these gyres. There's a lot more information about these gyres on the
5Gyres website, a non-governmental organisation pledging to help clean up this problem!
As shown by the list posted above, the common culprit of the marine
debris problem is that of the macroplastic (e.g. plastic bags!), however plastics that appear naked to the human eye are also a huge problem. Small plastics less than 5mm in diameter are referred to as microplastics and are becoming a bit of an issue within the marine realm. I've been meaning to post this blog post for sometime now after such good feedback from one on my other 'project' - LiveFoodLove. Earlier in the month I wrote up a little piece (
"To scrub, or not to scrub") about the issues of plastics present in cosmetic products, namely facial and body scrubs. A lot of people seemed quite unaware of their potential danger and I guess, from their point of view, it's very easy to forget about those little things we just cannot see.
 |
| http://www.bbc.co.uk/news/science-environment-16709045 |
Of course, the cosmetic industry is not to blame entirely for microplastics can have various other entry routes. One interesting example that I noted an article I wrote (on this subject, actually) was to do with the release of microplastics from our clothes. A group of researchers (Browne et al. 2011) tested waters from shoreline habitats around the world, noting that the most common polymers consisted of polyester, arcylic, and nylon (polyamides) fibres - this links them back to synthetic clothes. Shockingly, in excess of
1,900 of these microplastic fibres can be released into wastewater from the laundering of a
single synthetic item. Considering that some people do two loads a day (of course family-size dependent) this is an alarming amount. Living in a house of six (granted, poor students who need to pay the bills) the washing machine is on at least once or twice a day. Imagine that we have, say, 4 items per wash that are synthetic (figure plucked out of my head, completely inaccurate) and every day we are doing two loads. Per week we have (in theory) released
106,400 fibres into the environment. That is
one household.
Compared to their larger older brothers, the macroplastics, microplastics are a bit like the evil unknown at the moment because no one really understands what direct effect they can have on the marine environment, particularly at ecosystem level. Baseline data is often difficult to collect as you can imagine - most of these little plastics are less than 1mm in length and, as such, cannot be tallied in a survey from a boat. There persistence in the marine environment has therefore been assessed by other means, such as via CPRs. Continuous Plankton Recorders (not cardiopulmonary resuscitation...) can be deployed from merchant vessels and towed during a normal day-to-day sail. Via this method, collaborative work between SAHFOS (Sir Alistair Hardy Foundation for Ocean Science) and the University of Plymouth (where I did my undergraduate - hurrah) has shown that there has been a significant increase in the amount of microplastics present over the last 40 years.
Marine litter has the potential to cause a myriad of problems for marine ecosystems. Plastics are likely to cause problems associated with:
- Facilitating the movement of alien species, or
- Entanglement of marine species, or
- Ingestion of the plastics.
Non-indigenous speciesIn July 2009, Murray Gregory from the University of Auckland published a study in the Philosophical Transactions of The Royal Society B assessing the environmental implications and dangers posed from marine litter in our oceans. One of the main concerns that he highlighted was the potential for individuals to ‘hitch-hike’ on floating marine debris therefore moving them elsewhere into areas previously inaccessible. This movement of ‘alien species’ can have serious detrimental effects of resident populations and may drive species’ extinctions. In remote areas such as the tropical islands of Oceania or the sub-Antarctic islands, resident species may be unique to that area and as such warrant serious consideration for their protection.
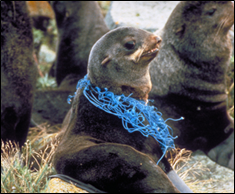
Entanglement
 |
| Image source: Greenpeace |
Over 100,000 of marine mammals die annually due to either ingestion or entanglement of marine debris, and considering that this figure only applied to the North Pacific Ocean, it is expected that the global marine mammal mortalities associated with marine litter is to substantially exceed this figure. Entanglement is a serious problem for species living amongst areas of high marine litter, particularly when composed of derelict fishing gear (such as long-lines or drift nets), synthetic ropes or packing bands.
 |
| Image source: NOAA |
Although there are a number of marine species affected marine mammals, who, being naturally curious and playful, are attracted to floating debris and so are most at risk. Fur seal pups, for example, are highly vulnerable, resulting in a drawn-out death sentence. The collar of marine debris tightens as the seal grows, constricting arteries and strangling the animal. The death of marine mammals at such a young age can have long-term effects on population stability and, as such, may hinder population recoveries. It is expected that with an increase in plastic pollution there will be a quickening in population decline of the northern sea lion, northern fur seal, and endangered Hawaiian monk seal.
Ingestion
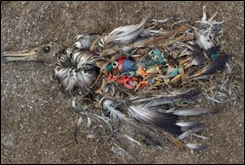 |
The
hard truth; Albatross chicks are fed plastic particles
mistaken for food and as a
result die from starvation, suffocation
or toxicity. (Image source: Chris Jordan). |
Marine litter can be small and easily mistaken for food and so ingestion of marine litter is quite a common problem amongst marine species. Ingestion causes a magnitude of problems ranging from:
- Sub-lethal: Decline in feeding resulting in starvation and stunted growth rate due to malnutrition.
- Lethal: intestinal or oesophageal obstruction.
The relative abundance of plastic and plankton in the North Pacific Ocean reveals shocking results. In a study in 2001, on average 330,000 pieces were found per square kilometre with a max count of nearly one million. This is likely to affect a number of organisms based on their feeding habits. Seabirds, filter-feeders, and other species that feed within the ocean’s surface layers are likely to be affected. Laysan albatross chicks of the Midway Atoll (Northern Hawaiian Islands) are severely affected; of the 500,000 individuals born annually 200,000 die as a result of the debris accumulation from the Great Pacific Garbage Patch.
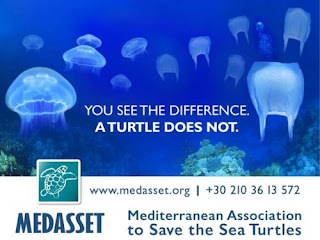
This issue is hardly undocumented with various campaigns flying around to try and educate the plastic user about the problems of inappropriate plastic disposal. My favourite (in a morbid way, I mean it is more effective) is that by the Mediterranean Association to Save the Sea Turtles (MEDASSET). I remember posting this up on Facebook a fair few months ago and a fair few of my friends did not even notice the plastic bag, If they can't even notice it then how do you expect a turtle to? In fact, a study published in 2010 revealed that one in three sea turtles found stranded or dead in the Adriatic Sea had debris (ropes, plastic and long-lines) present in their gastrointestinal tract.
As well as the ingestion of macroplastics, the ingestion of microplastics is a growing concern given their tendency to absorb Persistent Organic Pollutants or POPs. The most common POPs include PCBs (Polychlorinated biphenyls), DDT (Dichlorodiphenyltrichlorethane), and BPA (Bisphenol A). Various adverse health effects have been documented with regards to these, ranging from effects on the immune system, reproductive system, nervous system, and the endocrine (hormone) system. DDT, for example, can induce what is referred to as imposex (development of male sex characteristics) in dogwhelks, whilst BPA mimics oestrogen causing problems to both fish and humans. POPs accumulate in the animal's fatty tissue and, with this in mind, apex predators of the ocean food chain tend to show the highest levels.
 You are what you eat.
In the UK alone we are estimated to consume over 380,000 tonnes of seafood per year. Given what I have just told you about POP accummulation and such, seafood consumption includes toxic and plastics remains too. The
Nephrops (Scampi)
fishery, a commerically important fishery within UK waters (bringing in about £95.8 million per year), was studied in 2011 for plastic remains. Over 83% of
Nephrops caught contained little indigestible plastic fibres.
The image on the right
(source: http://www.care2.com/causes/you-are-what-you-eat-and-youre-eating-trash.html) is a fantastic pictorial of the marine debris problem, relating it back to human consumption. Just to highlight some key points from it:
- Humans consume, on average, 36lbs of seafood per person per year.
- The Great Pacific Garbage Patch contains an estimated 3.5 million tonnes of rubbish.
- 51 billion bottles are used (yearly) in the U.S. alone, only 1 in 5 are recycled.
- 260 known species eat non-biodegradable plastic materials (of course not out of choice, it is mistaken for food!)
- Some of these fish are eaten by other fish, the contamination is therefore biomagnified up the food web.
Mitigation
I understand that telling the ever-increasing population that they all have to ditch their synthetic clothes and reduce their weekly washing amounts is an unlikely scenario (and would most likely result in me being a very unpopular person). Being a little more careful about what we buy - cosmetics especially - will help substantially with the microplastic issue.
Reducing macroplastic prevalence is much easier (easier said than done mind you), but make a few simple changes and you're on your way to helping the environment.
Reduce, Reuse, and Recycle.
It is imperative that there is a continuation in these 'three Rs'. This should reduce the amount of waste discarded within the environment, a lot of which ends up in our oceans. The UK effort for the recycling programme has improved substantially over the years, so let’s continue our efforts. Reducing the amount of waste discarded is easy, opt for a re-usable cloth bag for groceries and only drink beverages in glass bottles or buy items with very limited packaging. If you DO use a shopping bag for whatever reason, do reuse it. We actually have a drawer in the kitchen stuffed full of shopping bags. They will always be used for for rubbish and never thrown away AS rubbish.
Beach-cleans
For marine debris that has washed up on our coasts, the solution is simple and requires very little physical effort. Beachwatch, MCS' coastal environmental initiative, aims to involve local people and communities that want to help clean up the shore. They organise various big beach clean ups (as aforementioned) so check out when the next one is and get involved. Even if you are not part of a formal clean-up programme, next time you’re at the beach take a bag and pick up some of the rubbish yourself.
Every little helps!